How to Calculate and Interpret Geometric Mean Titers
What is a geometric mean titer?
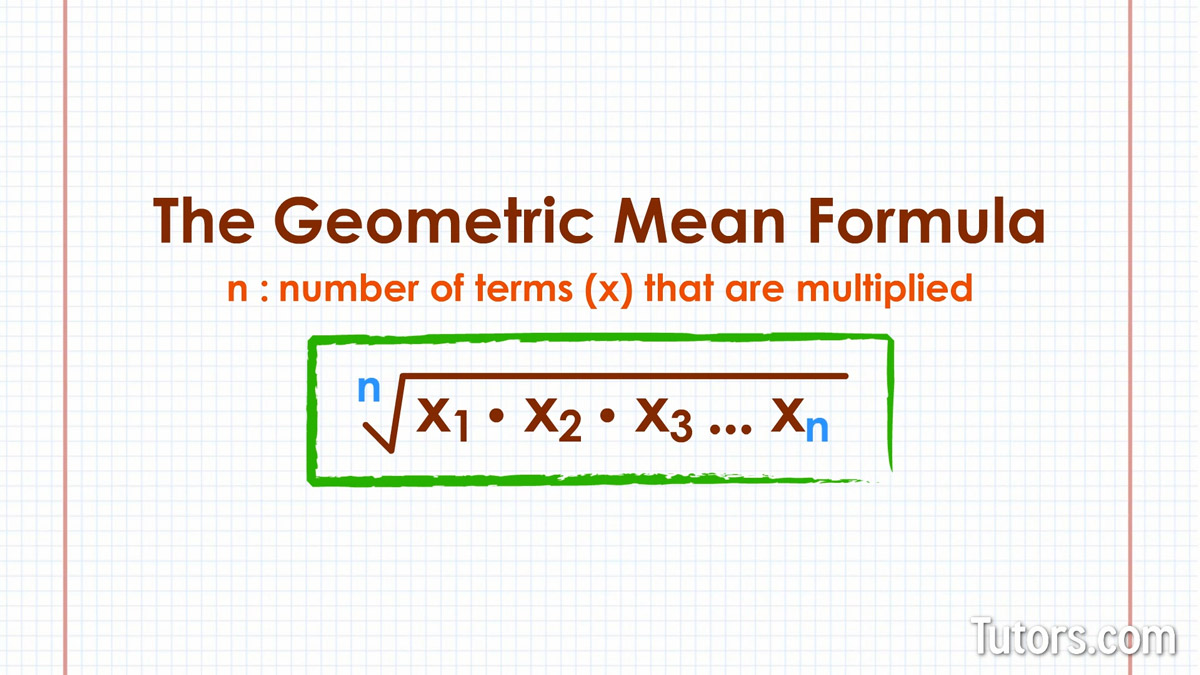
The term “geometric mean titer” (often shortened to GMT) refers to the average level of antibodies measured across a group of samples, where the values are expressed as dilution factors. Because titers are inherently multiplicative—each step represents a doubling or halving of concentration—the arithmetic mean can be misleading. The geometric mean, which multiplies all values together and then extracts the nth root, provides a more realistic central tendency for these skewed data.
Why the geometric mean makes sense for titers
Antibody titers typically follow a log‑normal distribution. In practical terms, a few very high or very low readings can pull an arithmetic average far away from what most participants actually exhibit. By converting titers to their logarithmic values, averaging, and then back‑transforming, the GMT balances extreme values and reflects the typical immune response more faithfully. This approach is standard in vaccine trials, serology surveys, and many clinical laboratories.
Step‑by‑step calculation
- Gather the raw titers. List each dilution factor (e.g., 1:20, 1:40, 1:80) as a numeric value—20, 40, 80, etc.
- Convert to logarithms. Take the natural log (ln) or base‑10 log of every titer. Using base‑10 is common because dilution steps are often powers of two, but the choice does not affect the final GMT as long as you stay consistent.
- Compute the arithmetic mean of the logs. Add all log values together and divide by the number of samples.
- Back‑transform. Raise 10 (or e, if you used natural logs) to the power of the mean log. The result is the geometric mean titer.
- Round appropriately. GMTs are usually reported to the nearest standard dilution (e.g., 1:32, 1:64) for easier interpretation.
For illustration, imagine five participants with titers of 20, 40, 80, 160, and 320. Their base‑10 logs are 1.30, 1.60, 1.90, 2.20, and 2.50. The average log is (1.30 + 1.60 + 1.90 + 2.20 + 2.50) ÷ 5 = 1.90. Raising 10 to 1.90 yields about 79, which we would round to the nearest conventional dilution—80. Thus, the GMT for this small cohort is 80.
Interpreting the result
A GMT offers a snapshot of the collective antibody strength. Higher GMTs generally indicate stronger or more prevalent immunity within the group, while lower values suggest weaker responses. However, interpretation must consider the assay’s detection limits and the clinical context. For instance, a GMT of 40 in a flu vaccine study might be deemed protective, whereas the same number in a hepatitis B trial could fall short of the desired threshold.
When comparing groups—say, vaccinated versus placebo—the ratio of GMTs (often expressed as a “fold‑rise”) becomes informative. A two‑fold increase after boosting suggests that the second dose effectively amplified the immune response. Researchers also report confidence intervals around the GMT to convey statistical uncertainty.
Common pitfalls and best practices
One frequent mistake is treating undetectable titers as zeros before log conversion, which would produce undefined values. Instead, assign a value equal to half the lower limit of detection (e.g., if the assay’s cutoff is 10, use 5) to preserve the log transformation.
Another issue arises when mixing different dilution series (e.g., some labs report 1:20, others 1:25). Standardizing the dilution steps before calculation eliminates artificial variance. Lastly, always double‑check that you’re using the same log base throughout; mixing natural logs with base‑10 logs will distort the final GMT.
Practical tips for reporting
- State the log base used (commonly base‑10) and the rounding convention.
- Include the number of samples (n) alongside the GMT.
- Provide confidence intervals or standard errors when possible.
- Clarify how values below detection were handled.
FAQ
How does a geometric mean differ from an arithmetic mean?
The arithmetic mean adds all values together and divides by the count, which works well for normally distributed data. The geometric mean multiplies values and then extracts the nth root, making it suitable for data that span several orders of magnitude—like antibody titers.
Can I use the geometric mean for a single participant’s titer?
For a single measurement the concept of an average isn’t applicable; you simply report the observed titer. GMTs become meaningful only when you have a group of values to summarize.
Why do some studies report “GMT ± SD” while others give confidence intervals?
Standard deviation (SD) describes variability around the log‑transformed mean, but confidence intervals directly convey the precision of the estimated GMT. Many journals now prefer confidence intervals because they are easier for readers to interpret in the context of statistical significance.
Is there a software tool that automates GMT calculation?
Most statistical packages—such as R, SAS, or even Excel—can compute the geometric mean with a few commands. In R, for example, exp(mean(log(titers))) returns the GMT when you work with natural logs.